Someone captured the savings. It wasn't you.
For a decade, New Zealanders have been told that rising energy costs are a fact of life. Inflation, global commodity markets, the cost of maintaining an ageing grid. All true to a point. What the bill left out: over that same decade, the cost of generating electricity fell 70 to 90%. Solar panels down 90%. Batteries down 90%. Wind turbines down 70%. Cheaper inputs, more expensive bills. That gap didn't disappear. It went somewhere.
A regular New Zealand household spends $8,739 a year on energy: electricity, petrol, vehicle ownership, gas. By 2030, that same household could pay $5,417 with an EV, or $3,125 under Transport-as-a-Service. A 38 to 64% cut, on technology that already exists and is getting cheaper every year.
The arithmetic works. An EV running on home electricity cuts transport fuel cost by around 37% against petrol today, and more as solar self-consumption rises. A heat pump replaces gas at three to five times the efficiency. A 7 kW rooftop solar system at 2030 prices covers roughly your full household electricity demand. Each number comes from NZ-anchored cost trajectories (detailed in the companion data panel).
The reason that prosperity isn't already on your bill is structural. The electricity market was designed for centralised generation, large stations feeding a passive grid with network charges layered on top. The regulatory framework was designed for passive consumers, households that buy, not produce. The financing system was designed for a different asset class, debt that amortises over five years rather than solar panels that pay returns for 25. Each of those structures is now mismatched to the technology, and each is being held in place by the institutions that benefit from it.
Energy prosperity by 2030 is a choice. The technology has done its job. Policy reform is what remains.
The $8,739 Bill Has Three Parts — All Moving the Wrong Way
Electricity, transport, and heat: each one is getting heavier on its own.
That $8,739 household energy bill breaks into four lines. Electricity: $2,625 (7,500 kWh at 35 cents a unit). Gas for hot water, heating and cooking: $800. Petrol to run the family car: $2,734 for 12,000 kilometres at current pump prices. Vehicle ownership costs (depreciation, insurance, registration, maintenance): $2,580. Every line trending up.
These aren't silos. They're connected. The electricity bill sets the floor for everything else, because the alternative to gas heating and petrol driving is electrification, and electrification's attractiveness depends on how much an electron costs. If the electricity price falls, the case for heat pumps and EVs strengthens. If it rises, the case weakens and households stay locked into the fossil options they already have. The price of a kilowatt-hour is the swing variable across the whole $8,739.
Electricity: a centralised system passing on its costs
At 35 cents per kilowatt-hour delivered, NZ sits toward the expensive end for a country with 85% renewable generation. Generation accounts for 38.5% of that price. Transmission (Transpower's high-voltage grid) accounts for 8%. Distribution (the 29 local lines companies) accounts for 24.5%. So 32.5% of every electricity bill, before you've used a single watt, is a network charge: the cost of moving electricity from where it's generated to where it's used.
That network cost matters now more than it ever has, because it sits directly in the path of the technology deflation that should have reduced bills. Solar costs fell 90% over a decade. Batteries fell 90%. Wind turbines fell 70%. The cost of producing electricity dropped further and faster than almost anyone forecast. NZ's delivered residential price went the other way, up 37% in nominal terms between 2018 and 2026. The technology deflation happened. It just didn't reach consumers.
And it's not getting better. The Commerce Commission has approved approximately 37% real revenue increases for distribution companies across the next regulatory period. Network costs will rise faster than inflation regardless of what happens to generation costs upstream. These charges flow through to every household bill, year after year, compounding. The gap between what solar and batteries cost to make and what electricity costs to buy at the meter is where the deflation went. It didn't reach you. It was absorbed by the network delivery chain.
Transport: direct exposure to global oil
The electricity bill is expensive. The transport bill is exposed. Petrol at $2,734 a year is a direct link between the household budget and global oil markets: NZ has no ability to influence them, no strategic reserve to buffer against them, no domestic supply to fall back on. Every time there's a conflict, a shipping disruption, or a production decision by an OPEC+ member, the pump price moves and the $2,734 estimate becomes unreliable.
The comparison is already there. An EV charged at home runs at roughly $14.40 per 100 kilometres (15.7 kWh at 35 cents, plus Road User Charges). A petrol car covering the same distance costs $38.50 at current prices. That's a 37% advantage per kilometre for the EV at today's electricity price. As electricity from rooftop solar becomes cheaper and petrol stays volatile, that gap only widens.
Add the $2,580 in ownership costs and the full cost of running a car is $5,314 a year. That's more than half the entire household energy burden, and it's entirely exposed to two inputs the household can't control: the global oil price and the depreciation curve of a combustion engine.
Heat: gas getting more expensive while supply contracts
About 30% of New Zealand homes use piped gas, paying around $800 a year on average. On the surface that's the smallest of the three cost lines. But it's deteriorating fastest.
Domestic gas production has fallen sharply. Gas-dependent businesses across food processing, horticulture, and manufacturing are reporting price increases of up to 100% on contract renewal. The gas that's left is getting more expensive to extract, and there's less of it every year. For residential users, the dynamic is slower but the direction is the same.
Meanwhile, the alternative has been economically ready for years. Heat pumps operate at a coefficient of performance of 3 to 5, delivering 300 to 500% of the energy they consume. A gas boiler delivers 75 to 95%. The same dollar of energy input, via a heat pump, produces three to five times more useful heat. The physics are settled. The economics are settled. The reason households and businesses haven't switched at scale is upfront capital cost and the perceived risk of a contract switch at the wrong moment.
The direction of travel
Three cost lines, three different underlying problems. Electricity: network costs absorbing the deflation that should have reduced bills, with more approved increases to come. Transport: direct and unhedged exposure to global oil prices, with no domestic buffer. Heat: a supply-constrained fossil fuel getting more expensive with every passing year, while a better alternative sits underutilised.
Each line is moving in a direction that makes the burden heavier. The technologies that could reverse all three — solar, batteries, EVs, heat pumps — are already cheaper and getting cheaper faster. The problem isn't the technology. It's the market design, the regulatory settings, and the financing architecture that stand between households and the bill that physics says is already available.
By 2030, the Same Household Pays $5,417 or $3,125. The Tech Is Already There.
Two scenarios, one conclusion: the energy bill is structurally different.
Same kids. Same Auckland street. Same income. The only thing that's different in 2030 is how energy flows into the household and what it costs. Under the EV-ownership scenario, the total energy bill is $5,417 a year: a 38% reduction on today's $8,739. Under Transport-as-a-Service, it's $3,125: a 64% cut. Neither number requires a technology that doesn't exist. Both require that existing technology be financed and that the regulatory architecture allows it to compete fairly.
Three things change to get there.
Electricity at home becomes substantially self-generated
The conventional assumption is that electricity is something you buy. By 2030, for households that can access the capital, most of it is something you produce.
A 7 kW rooftop solar system in 2030 costs approximately $7,000 installed and produces around 10,200 kWh per year (SEANZ, 2025). That's roughly equivalent to a household's full annual demand once gas heating has been replaced by a heat pump. A 13 kWh home battery, priced at approximately $5,200 by 2030 on NZ cost trajectories (Rewiring Aotearoa, 2025; TEA analysis), stores midday generation through to the evening peak. An EV with vehicle-to-home capability lifts self-consumption to around 80%: the car charges from the solar array during the day and supplies power back to the house when the sun drops. The grid supplies the 20% top-up.
The combined electricity bill, covering the electricity you used to buy and the heat that used to come from gas, drops from $3,425 today to $1,925 in 2030. That $1,500 reduction across a single cost line accounts for the majority of the household's gain.
Transport runs on electrons, or disappears from the balance sheet entirely
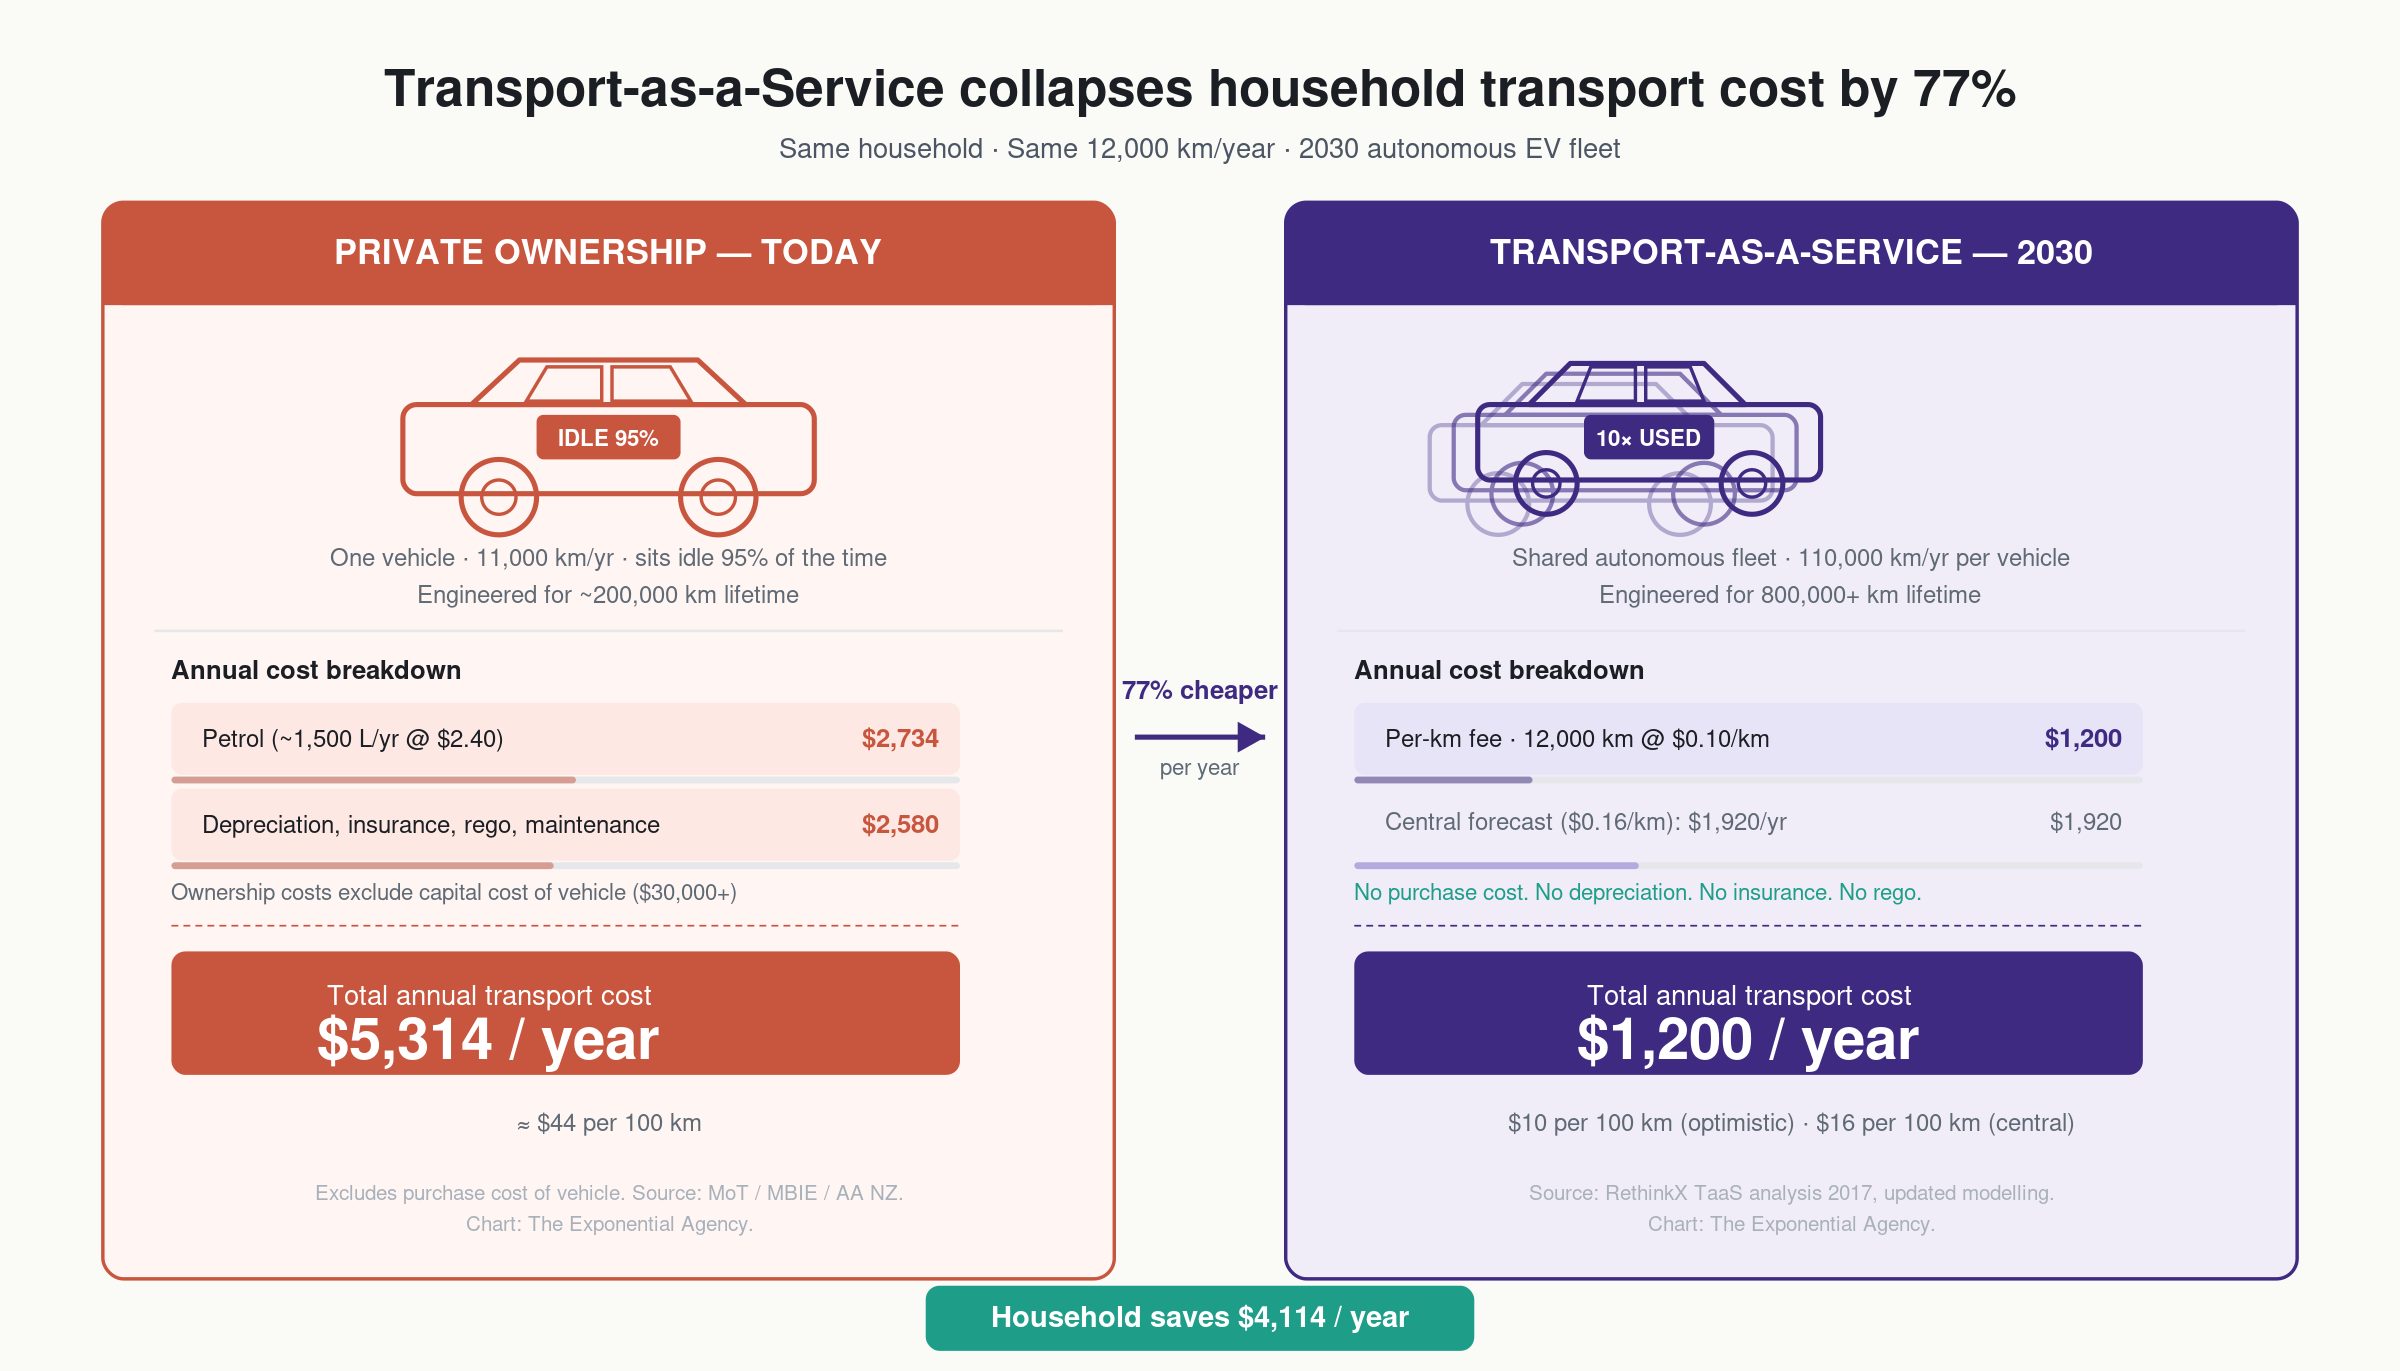
In the EV scenario, the car is still there and vehicle ownership costs are roughly unchanged. What changes is the fuel line. An EV charged primarily from the rooftop solar system burns no petrol and draws little from the grid. The direct transport cost drops to Road User Charges: $912 a year (NZTA, 2025). The vehicle has become mobile household storage, charging when the sun is out and supplying the house when it isn't.
In the TaaS scenario, the vehicle disappears from the household balance sheet. Autonomous shared mobility at $10 per 100 km covers 12,000 km for $1,200 a year (RethinkX, 2026). No purchasing, no insuring, no maintaining. The full $5,314 currently funding private vehicle ownership and fuel collapses to a single usage charge 77% lower, which is what moves the total household energy bill to $3,125.
Heat is electric, and the gas line goes to zero
Heat pumps deliver 300 to 500% efficiency compared to gas at 75 to 95% (EECA, 2025). By 2030, with gas supply contracts already renewing at up to 100% higher than the prior period and domestic production continuing its decline (EECA, 2025), the economics are unambiguous. The gas bill goes to zero. The additional electricity demand is largely covered by the rooftop solar, which is one reason the 7 kW system was sized as it was. That's what bends the electricity bill down while absorbing a demand that used to sit on an entirely separate cost line.
Three preconditions, not three certainties
The technology will look after itself. Solar and battery cost trajectories are set by global manufacturing scale, not NZ policy. The 15% per year battery cost reduction used here is conservative against the actual global curve (BNEF, 2025). What won't happen automatically: finance access, fair market rules for distributed energy, and a regulatory architecture that doesn't penalise households for generating their own electricity. Each is a policy question. Each is the subject of the next section.
The destination is $5,417 or $3,125. The technology is ready. The gap between here and there is structural reform.
The Technologies Doing the Work
Solar, batteries, and autonomous EVs. All on the same cost curve. All past the tipping point.
Two kinds of energy system exist. In a resource-driven system, every kilowatt-hour requires fuel, extracted, processed, shipped. The easy fuel goes first. Everything after that is deeper, more remote, more expensive. That's the curve NZ electricity has followed for two decades.
In a technology-driven system, the unit is manufactured, not extracted. Every doubling of cumulative production cuts cost by a predictable percentage. That's Wright's Law, the same dynamic that made televisions, broadband, and smartphones progressively cheaper and better, year after year, whether you planned for it or not. Solar panels and batteries are now firmly in the second category. The cost trajectory inverts. Making more means paying less.
NZ electricity policy has treated solar like a niche supplement. The technology is now treating the grid like a competitor.
Solar — democratised generation
The economics are simple once you make the right comparison.
An all-in rooftop residential solar system in 2030 (installed, financed at 5% over 25 years) costs roughly 6 to 8 cents per kilowatt-hour. The delivered grid price is 35 cents. That's already a 4x gap.
But the real comparison is solar versus the full delivered bill, not solar versus wholesale generation. Every kilowatt-hour generated and consumed behind the meter avoids not just the 38.5% generation component — it avoids the full 32.5% network charge as well. Lines charges, Transpower costs, distribution margins: all bypassed. Distributed generation competes with the delivered price, including every layer stacked on top of it. That's why the economic case is overwhelming.
NZ's official forecast has solar reaching 4.3% of generation by 2035. Hungary reached 25% in five years. The gap between forecast and trajectory is not a technical problem.
Batteries — the prosumer enabler
Solar covers the daytime. Batteries cover the rest.
The barrier has always been cost. That barrier is collapsing. NZ residential battery cost stands at $900/kWh installed in 2025. At a 15% annual decline (conservative against the global trend), that reaches $399/kWh by 2030. A 13 kWh home battery costs roughly $5,200 installed at that price.
At $399/kWh, a home battery stops being a luxury and becomes the standard companion to a rooftop system. A 13 kWh battery paired with vehicle-to-home capability from the household EV covers most evenings from stored midday solar. The grid becomes the backup, not the primary supply.
The systemic impact is larger than the individual one. Aggregate that distributed fleet across hundreds of thousands of NZ households, coordinate it with software, and it becomes a vast virtual power plant. It absorbs the midday solar surplus. It injects into the evening peak. It reduces the frequency and duration of calls on expensive fossil-fuelled peakers. Lower peak demand means lower system costs — for everyone, not just the households with batteries.
Transport-as-a-Service — the disruption of personal mobility
A privately owned car travels around 11,000 km a year and sits idle 95% of the time. Depreciation, insurance, warrant, registration, and maintenance accrue whether it moves or not. The asset is deeply underutilised.
A TaaS vehicle — autonomous, electric, shared — travels 110,000 km a year and is engineered for 800,000 km or more over its operational life. The capital cost amortises over ten times the distance. The economics follow from the utilisation.
RethinkX's central forecast: USD $0.16 per mile by 2030, falling to $0.05 per mile for pooled services. Translated to NZ: $5 to $16 per 100 km depending on service tier. The planning assumption used in this analysis is $10/100 km, optimistic but within the modelled range.
This is no longer speculative. Autonomous fleets in Chinese and US cities are now clocking millions of kilometres with progressively less human intervention. Waymo's at-fault crash rate for fully driverless miles runs well below the human baseline in matched conditions. The technology is operational. The economics are compressing. The deployment curve has started.
The product is just better
Mass adoption doesn't require a mandate. It requires the new product to be tangibly better and cheaper than the one it replaces. At that point, individual decisions aggregate into a transition.
EVs are quieter. They accelerate harder. They need less maintenance. They cost a fraction to run. Solar and battery ownership converts the household from a passive bill-payer into an active producer, one that sells back into a grid that was designed to sell to them. TaaS removes parking costs, insurance, depreciation, and maintenance entirely. The user pays per kilometre of actual use.
Even heavy freight tips. On the Auckland-Tauranga corridor, an electric truck saves roughly NZ$277 per trip compared to diesel, an 81% reduction in fuel cost per trip, with fleet payback running under five years at current diesel prices. Mining haulage, interstate logistics, refrigerated transport: the same pattern repeats. Imported diesel is expensive and volatile. Electric drivetrains lock in a stable, declining cost base.
The collective pull of millions of household decisions, all chasing better and cheaper, is the primary engine of this transition. Policy can accelerate or obstruct that engine. It cannot substitute for it. The next question is what grid those decisions flow into.
The grid that fits the new technology is cellular, not centralised
From one-way pipes to self-balancing neighbourhoods — and why existing wires work better under the new model
The post-war grid was designed for a specific kind of energy world. A handful of large generators, hydro stations, thermal plant, sitting at the top of the system, pushing power one way through high-voltage lines to millions of households who had no say in the matter except the light switch. That architecture made sense when energy was centralised and consumers were passive.
The technology has moved on. Solar panels sit on rooftops across the suburb. Batteries sit in garages. EVs charge overnight and export back to the grid in the morning. The generators have multiplied from dozens to millions, and most of them are already close to where the power gets used.
A one-way architecture designed for the old system doesn't fit the new one.
Holons: the pattern that fits
Dutch energy researcher Auke Hoekstra uses the word holonic to describe the architecture that works. A holon is both a whole in itself and a part of a larger whole. The pattern comes from biology and scales across any self-organising system.
In practice: a house with rooftop solar, a battery, and an EV is a solar building holon. It balances its own supply and demand first. It draws from or exports to the wider grid only for the remainder. A cluster of those houses forms a solar neighbourhood holon. The school with excess midday solar can power the EV chargers across the street without the electrons ever touching Transpower's high-voltage lines.
Scale up. Small batteries at the end of most streets (think the fibre cabinets you walk past every day). Larger community batteries at neighbourhood scale (think the Chorus exchange building two blocks over). Neighbourhood holons connect into solar zones incorporating data centres and transport hubs, whose demand patterns smooth out the residential peaks. Solar zones connect into the national grid.
This is not a replacement for existing infrastructure. Transpower's transmission backbone and the 29 EDB networks still carry the power; they just carry different flows. Instead of peak demand from millions of individual homes all pulling at the same moment, they carry the smoothed, net demand from self-balancing neighbourhoods. The same poles and wires, running more efficiently.
Two things it gets right that the old model can't
The national grid has to be sized for the worst case: every house in the street running the oven, the hot water, and the dryer at the same time. That coincident peak is expensive to engineer for. Distribution and transmission account for 32.5 cents in every dollar spent on electricity (MBIE Electricity Prices Review). In a holonic system, most of that balancing happens locally, before it ever hits the national grid. The national grid only sees the smoothed residual. Cumulative network investment over the next decade runs to $12-14 billion under current centralised planning. Handling balancing locally shrinks that number systematically.
The grid also becomes resilient. Today's system has single points of failure. One fault on a major transmission line causes a blackout across thousands of homes. A cellular grid degrades gracefully. When one piece fails, the rest keeps running. In a major disruption — an earthquake, a severe weather event — individual holons can island themselves, operating on local solar and battery until the wider grid recovers.
For a country that sits on a subduction zone and is watching its storm seasons get heavier, that's not an abstract benefit. It's an engineering requirement.
The technology is ready. The rules aren't.
South Australia already runs at or near 100% inverter-based renewable generation, more stably than it ran on coal. The architecture is proven at scale.
The question is whether New Zealand designs its regulatory rules to enable this model, or designs them to slow it down. That answer comes down to six simultaneous contests running across the NZ energy system.
The Technology Already Won Four of the Six Battles. The Prize Is Yours If Reform Follows.
Six battles, one transition. The first four are about what energy we use.
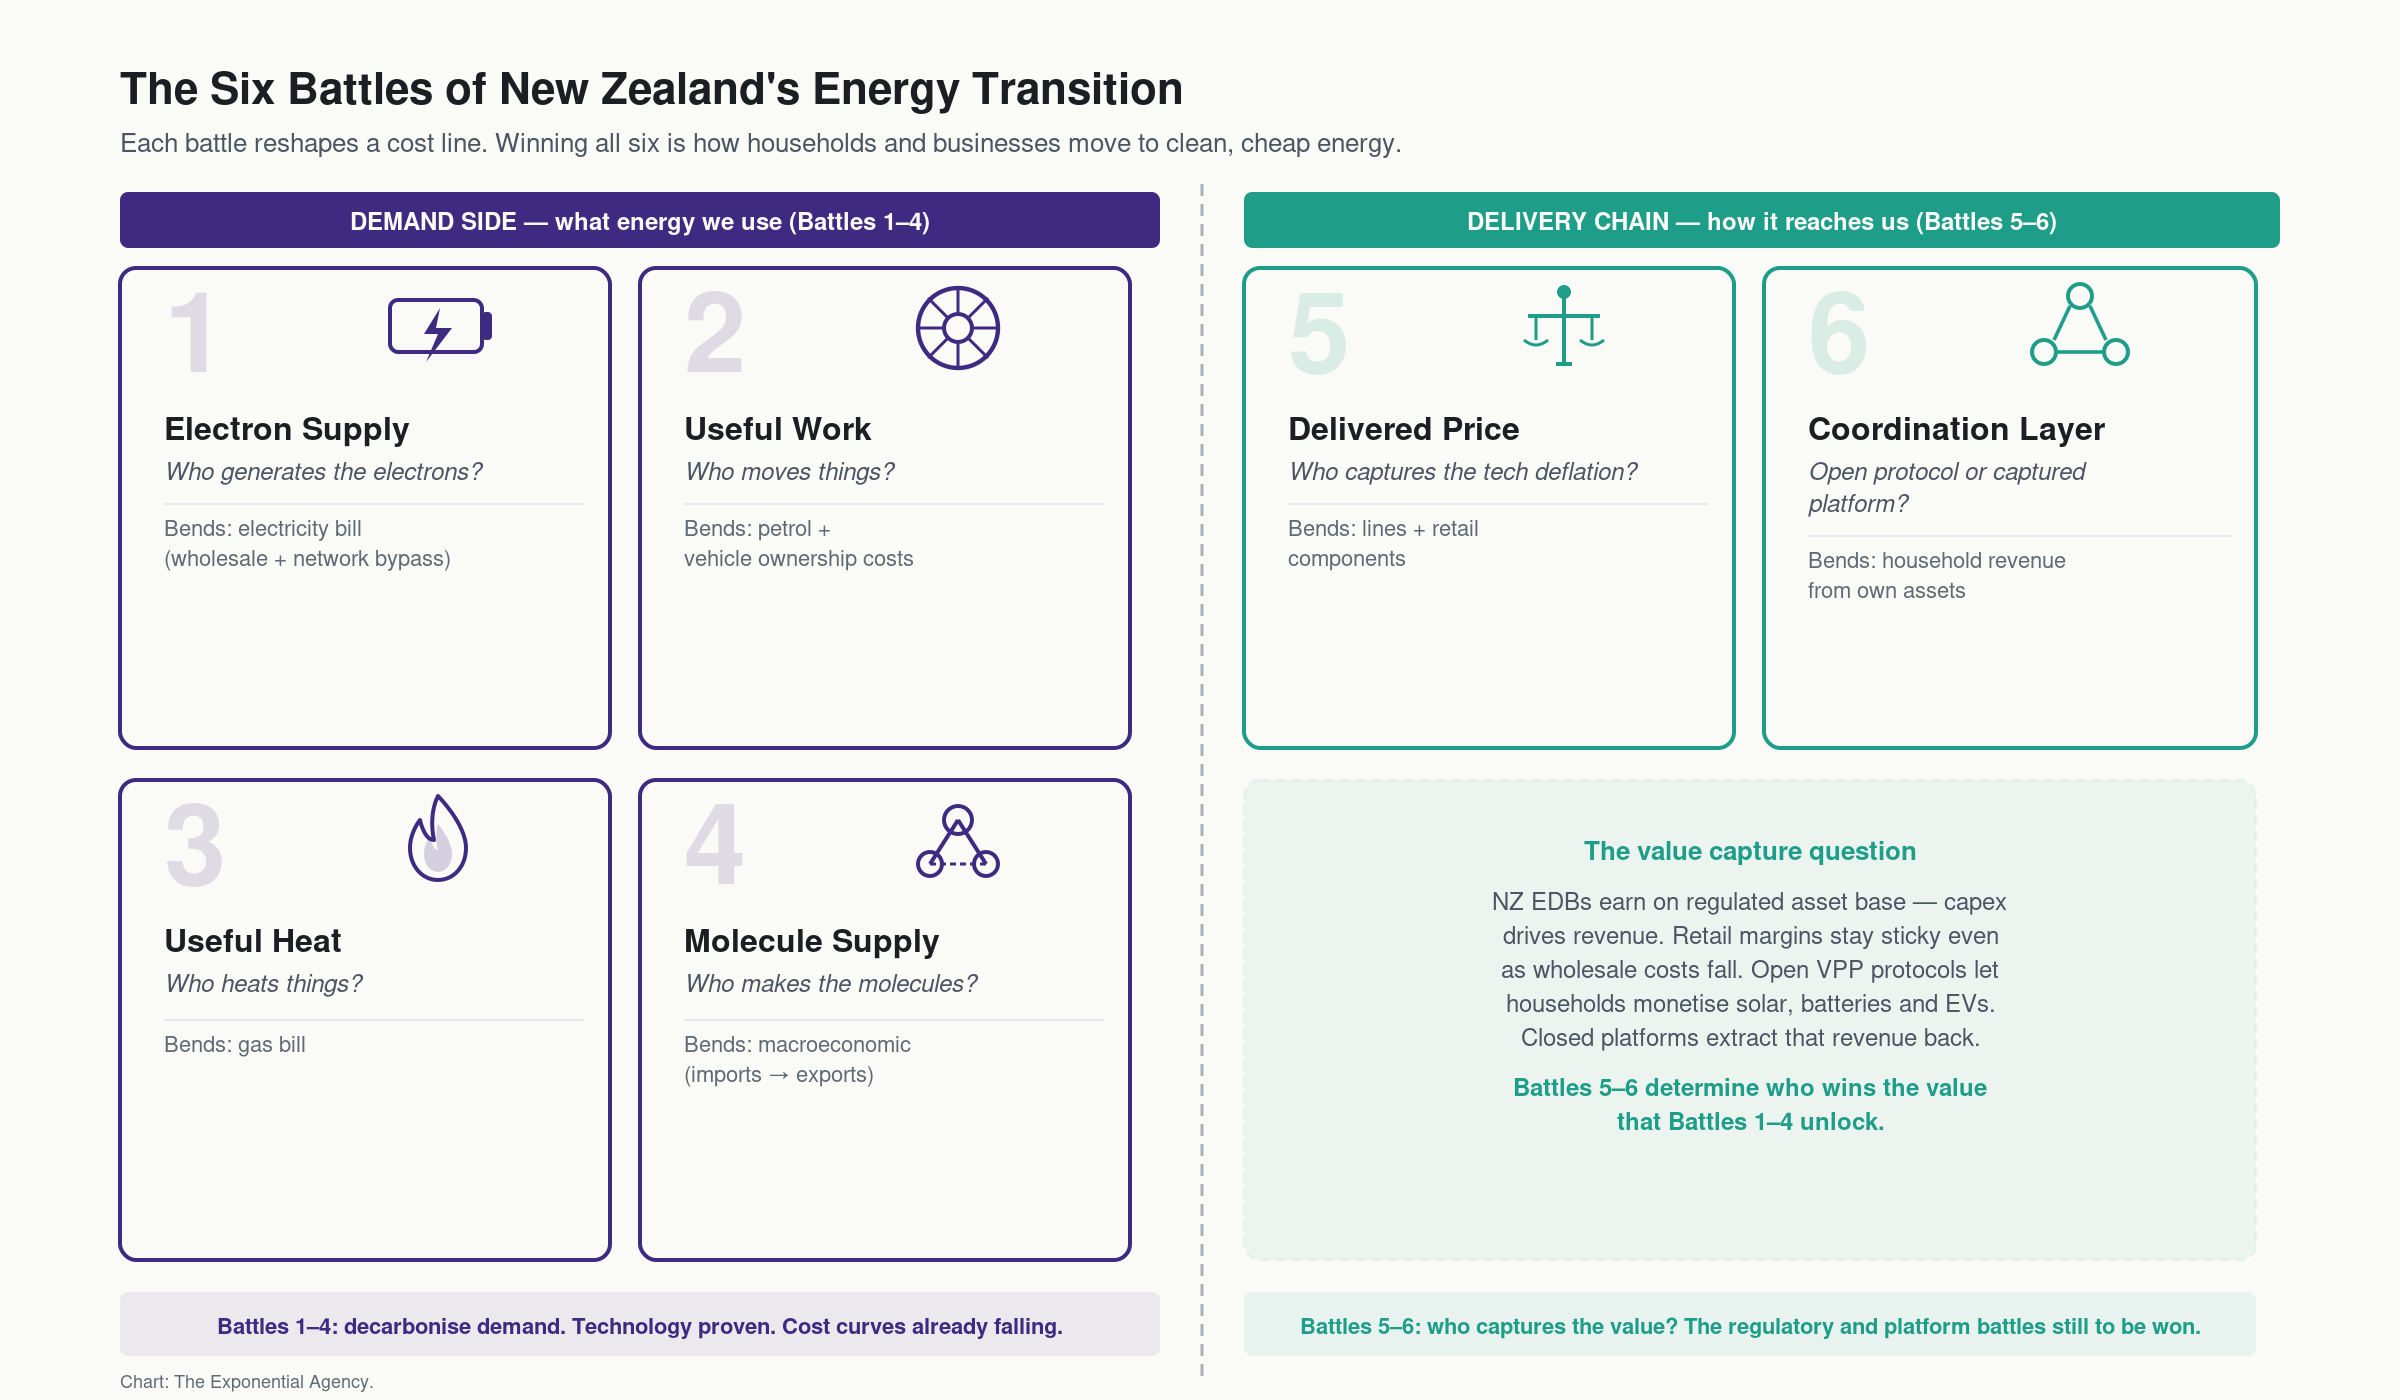
The shift from $8,739 to $5,417, or $3,125, isn't one reform. It's six. Six simultaneous contests running across the NZ energy system, each one determining where the household cost panel lands in 2030.
The battles split in two. The first four are demand-side: about what energy we use and which technology supplies it. In each one, the cost winner is already clear — solar and wind beat gas, electric motors beat combustion engines, heat pumps beat gas boilers, clean electrons beat imported molecules for most applications. The physics is settled. What's holding them back is market design, financing architecture, and in one case, technology still closing the last temperature gap.
The last two battles — who captures the cost reduction and who owns the coordination layer above the meter — are the delivery chain. Those come next. Here are the four demand-side battles.
Battle 1: Electron supply — who generates the electrons?
NZ's 85% renewable electricity is genuine. It also papers over a structural problem: solar is only 3% of NZ generation, despite being the cheapest electricity source over its lifetime by a widening margin. The market rewards scarcity (gas peaking to protect lake levels) not abundance. Solar, producing at near-zero marginal cost, enters a price formation mechanism designed for the opposite condition.
The result: the country with some of the best solar irradiance in the developed world is at 3% solar while Hungary, landlocked with worse sun, has already passed 18%.
The RethinkX end-state is costed: 35 GW solar, 8 GW wind, 201 GWh battery storage delivering 70 TWh annual supply with daily firming. That is 2x current demand, covering electrification growth while providing the surplus that makes green molecule production viable. Cost: $308 per person per year over 20 years. NZ already spends that on energy infrastructure. This is a market design problem, not an ambition or affordability problem.
Bends: the electricity bill — wholesale prices and the ability of distributed generation to bypass network charges.
Battle 2: Useful work — who powers motion?
An electric motor converts electricity to motion at over 90% efficiency. An internal combustion engine manages around 25%. That threefold gap is thermodynamic — no ICE improvement closes it. The electric motor's advantage grows as electricity gets cheaper and battery costs fall.
Globally, electricity supplied 80% of the increase in useful-work demand between 2019 and 2023. The IEA places peak oil demand in transport at approximately now. In NZ, the vehicle, farm, and industrial machine fleets together represent approximately 9 million fossil-fuel machines that are technically viable to electrify with today's technology.
This is a replacement cycle, not a programme — one machine at a time, at each natural replacement point, with economics that get clearer every year. The task is to remove the friction that slows it: regulatory penalties on early adopters, financing structures that lock households into combustion vehicles when the upfront cost gap hasn't been bridged.
Bends: the petrol line and the vehicle ownership line — together the largest single slice of the $8,739 household energy burden.
Battle 3: Useful heat — who heats things?
The hardest of the four. Heat is 43% of NZ's useful energy demand, with fossil fuels supplying 45% of it, roughly 27 TWh per year of gas and coal running boilers, driers, kilns, and hot-water systems. Unlike motion, heat has a temperature structure, and the solution changes with temperature.
Below 100°C — space heating, hot water, low-temperature industrial drying — heat pumps operate at 300 to 500% efficiency against gas at 75 to 95%. The physics gap is decisive. The economics are settled. The barrier is upfront capital and switching risk.
Between 100 and 300°C is the frontier. Industrial heat pumps reliably reach 100°C today; emerging refrigerants are pushing to 150 to 200°C with commercial credibility. The single biggest target is dairy: 7.6 TWh of fossil heat per year, concentrated in the 80 to 160°C range that industrial heat pumps are now entering.
The block is confidence, not capability. EECA's research found 70 to 80% of gas-dependent businesses see the transition as theoretically possible but financially unattractive — gas contracts are doubling on renewal, supply has dropped 45% in six years, but capital decisions are still being deferred. That's solvable: clear gas contraction timelines and transition financing. Without those signals, the largest fossil heat load in the country stays lit.
Bends: the gas line on the household bill, and the cost of every dairy product, meat product, and processed food a Kiwi household buys. Industrial heat decarbonisation flows through the supply chain.
Battle 4: Molecule supply — what's left once we've electrified everything we can?
Once battles 1 through 3 are won, what remains is a residual molecule problem. The thermodynamics currently favour fossil: converting electricity back into molecules runs at around 70% efficiency against fossil's 85%. Winning the first three battles makes this one dramatically smaller. Total fossil molecule demand shrinks from 27 TWh to roughly 8 TWh of hard-to-abate high-temperature industrial processes — cement, steel, chemical synthesis. A manageable residual target.
The end-state is macroeconomic. The RethinkX Prosperity scenario builds 40 TWh of surplus generation to cover the worst-case winter day, at near-zero marginal cost the rest of the time. At that price, domestic green hydrogen and ammonia become viable. NZ stops importing approximately $20 billion per year in fossil fuels and starts producing the clean molecules its residual industries need from domestic surplus.
Bends: not one bill line but the macroeconomic line running through all of them. A $20 billion annual outflow reversed is a current-account swing of structural significance, felt through wages, export earnings, and the cost of every imported good.
The Delivery Chain Battles
Battles 5-6: where cheap energy either reaches the household, or gets extracted before it does
The first four battles are about what energy we use. Technology has already won them; the cost curves don't reverse. The next two battles are different in kind: they're about who captures the value once the cheap energy exists. Market design and regulatory architecture determine whether the deflation from battles 1 to 4 reaches the household bill, or gets absorbed before it does.
Battle 5: Delivered Price — who captures the technology cost reductions?
Every input to electricity is a technology. Panels, batteries, turbines, inverters, chips: all follow cost curves that go one direction. Upstream solar is down 90% over the last decade. Batteries down 90%. Wind down 70%. NZ's delivered residential price went the other way: up roughly 35% in nominal terms over the same period. Wages didn't keep up. CPI didn't keep up.
The gap is margin being captured somewhere in the delivery chain. Three mechanisms do most of the work.
Network cost recovery on shrinking volume. Network capital costs are recovered across the kilowatt-hours sold. Per-capita electricity consumption has been declining for over a decade — appliances are more efficient, and a growing number of households self-generate. Fixed cost spread across shrinking volume means rising unit price. The Commerce Commission's most recent regulatory reset increased EDB revenue allowances by approximately 37% in real terms. The more efficient households get, the more the maths loads the bill onto their remaining kilowatt-hours. A death spiral by design.
Wholesale market design. Every generator is paid the clearing price set by the last unit dispatched, usually thermal. When solar and wind produce at near-zero marginal cost, they still receive the gas-set price. Our analysis of 2021-2024 wholesale data quantified the windfall at roughly $1.66 billion per year flowing to hydro generators. Cheap renewable energy, priced as if it were expensive thermal energy. The difference is kept as margin. Over the eleven years since partial privatisation, the major generator-retailers paid $9.45 billion in dividends against $1.38 billion in new renewable capex: a 7:1 ratio of extraction to investment.
Forward hedging in a thin market. NZ has a small, illiquid forward market. Retailers without their own generation must hedge spot risk somewhere; the counterparties selling those hedges are the same firms they compete against in retail. The generator-retailer sets the insurance price for its own competitors. When spot prices swung from $32/MWh in December 2022 to $519/MWh in August 2024, a 16x range inside two years, the volatility premium was repriced into every hedge contract in the market.
The end state: distribution pricing that prioritises asset utilisation over peak capacity expansion. Wholesale market design that removes the windfall margin in abundant hours (the cheap hours when renewables flood the grid should produce cheap bills, not a transfer payment to the last thermal plant running). Retail bills that publish the makeup of every kilowatt-hour by component, so each line item can be challenged on its merit.
The bends: the lines and retail components of the bill — the parts that distributed generation can't bypass on its own.
Battle 6: Coordination Layer — open protocol or captured platform?
The most structural of the six battles, and the easiest to lose quietly.
Above the meter, between household hardware (solar, batteries, EVs, hot water, heat pumps) and the wholesale market, sits a coordination layer. It does metering, aggregation of flexibility, wholesale bidding, and settlement. Whoever owns that layer captures the value the hardware below produces. The hardware owner gets a bill discount. The platform owner gets a business.
Two end states are possible.
An extractive oligopoly of generator-retailer incumbents and/or global hyperscalers swallows the aggregation layer. Citizens become tenants on hardware they already paid for. The asset is theirs; the revenue stream is someone else's.
Or an open coordination standard lets many operators connect — independent retailers, iwi aggregators, community trusts, new entrants all plugging into the same protocol. The layer is published, not owned. Competition then does what competition is supposed to do: compress the service margin to the minimum consistent with viable aggregation.
The NZ window is narrow. In other markets, the default is being set right now by platform incumbents — Tesla, hyperscalers, large generator-retailers. In NZ the layer is still contested. Independent retailers occupy pieces of it. Regulators have started scoping the rules but haven't locked the architecture.
The next 24-36 months, through to 2028, decide whether NZ's default is platform or protocol.
The end state: an open coordination standard covering metering data, telemetry from household solar and battery hardware, flexibility bids, and settlement. Any firm meeting the standard can compete. The layer is published, not owned. Ownership of the hardware below stays with citizens and community. The value of flexibility flows to whoever aggregates it, competed down to a thin service fee.
The bends: the household's ability to capture revenue from its own assets, and to participate in flexibility markets at a fair price. Without an open coordination layer, the household pays for the hardware and the platform owner captures the value.
What policy must actually do — the 18-policy package
The destination is concrete. The gap is political.
$2.0 billion of direct government spend over five years. $9.7 billion of total capital mobilised. A 4.84x multiplier on every dollar of public money. Thirteen to nineteen thousand FTE-years of work. A $3.5 to $5.5 billion direct GDP contribution, before you count the long-run benefit of lower fossil imports and structurally lower delivered electricity prices.
These aren't projections from a theoretical model. They're the costed outputs of 18 specific policies, grouped under the six battles and two cross-cutting reforms laid out in the companion Kick-start document. Each policy has a direct cost, a capital mobilised figure, a named legislative or regulatory pathway, and an estimated macro impact. The package is costed, sequenced, and shovel-ready.
Headline numbers across the full 18-policy package
| Total direct government cost (5 years) | $2.0 billion |
| Total capital mobilised (public + private) | $9.7 billion |
| Capital multiplier | $4.84 per $1 of public spend |
| New renewable generation enabled | ~2.1 GW |
| New battery storage enabled | ~1.6 GWh |
| Fleet vehicles electrified (commercial + government) | 35,000 |
| Industrial fossil heat displaced | ~10 TWh / year |
| Flexible load registered as grid resource | 400 MW+ |
| Equity-targeted households (5 years) | ~45,000 |
| Jobs created over the programme | 13,000–19,000 FTE-years |
| Estimated direct GDP contribution (5 years) | $3.5–5.5 billion |
Recurring long-term benefit through reduced fossil imports and structurally lower delivered electricity prices sits on top of the direct GDP figure.
The technology is ready. The economics are favourable. The barrier is policy. The Kick-start removes that barrier — not by restructuring the entire market from scratch, not by nationalising the gentailers, but through targeted financing instruments, regulatory sequencing, and two structural reforms that change what the system rewards.
Government doesn't write a $9.7 billion cheque. It writes a $2.0 billion cheque — through lending facilities, targeted subsidies, and regulatory design — and private capital and public institutions deploy the remaining $7.7 billion in response. The lending-facility model is the mechanism: government backs a loan that a household, a fleet operator, or an industrial processor repays from the operating savings the new asset generates. The capital recycles.
§6.1 The 18 levers, by Battle
Each Battle is a self-reinforcing cluster. The solar lending facility makes the residential battery subsidy more attractive. VPP batteries make the open coordination standard more valuable. Fleet EV incentives make the charging network viable. The logic compounds across battles as well as within them.
Battle 1 — Electron Supply (5 policies, ~$350 million direct, ~$5.5 billion mobilised)
The coordinated supply-side build-out: residential rooftop solar, residential and public-sector batteries, government power purchase agreements, and fast-tracked grid-scale battery storage. The centrepiece is the Residential Solar Lending Facility (Policy 1): a cost-neutral lending vehicle at OCR plus 2%, targeting 206,000 households over two years, mobilising $2.88 billion in solar installation at zero net fiscal cost because the principal and interest come back. It doesn't subsidise the solar — it solves the capital access problem that is the only barrier stopping households from taking up a technology that already pays for itself.
Residential VPP batteries (Policy 2) and public-sector VPP batteries (Policy 3) add 250 MW of peak-shaving capacity and 250 MWh of storage across schools, hospitals, government buildings, and marae, procured centrally to drive unit costs down. Government PPAs (Policy 4) underwrite around 1,900 GWh per year of new firmed renewable generation at no direct cost, using the Crown's credit-worthy offtaker status. Grid-scale BESS (Policy 5) adds 500 MWh of the wholesale price stabilisation the system needs as variable renewables ramp up.
Five policies. One coordinated build-out. Two to three gigawatts of new renewable generation and 1.5 to 2 GWh of new storage within five years.
Battle 2 — Useful Work (4 policies, ~$510 million direct, ~$2.0 billion mobilised)
Transport burns approximately $7.5 billion of imported petrol and diesel each year. Fleet electrification (Policy 6) targets 20,000 commercial fleet EVs through a $7,500 per-vehicle incentive, mobilising around $1.4 billion in private fleet capital. The gap between ICE and EV upfront cost is all that needs to be bridged.
Policy 7 — the AV-readiness programme — is the most forward-looking policy in the package and, as the manifesto analysis shows, the most politically uncontested. Eighty million dollars over five years to make NZ legally and operationally ready for autonomous vehicle operation by 2028 to 2029. Without that regulatory ground cleared, the Transport-as-a-Service cost reductions that get households to $1,200 a year in transport spend don't land. The 2030 numbers in the companion Vision document depend on it.
The EV charging network (Policy 8) pairs government co-investment in 500 fast-charger sites with a fix for the first-customer problem: right now, the operator who connects the first fast-charger to a constrained distribution network pays the full cost of the network upgrade, even though every subsequent connection gets the upgrade for free. That structural tax on first movers is suppressing private charging investment. The fix costs $130 million in total. Policy 9 closes Battle 2 by converting 15,000 central government vehicles over five years, using the All-of-Government procurement contract as a demand anchor for the EV market.
Battle 3 — Useful Heat (2 policies, ~$190 million direct, ~$820 million mobilised)
Industrial process heat is the hardest demand-side battle. The block isn't technology — dairy processing and low-temperature industrial heat are well within the commercial heat pump envelope. The block is capital. A dairy processor switching from gas to an industrial heat pump needs upfront capital to install equipment that pays for itself in three to four years from operating cost savings, at 25 to 55% lower energy operating cost. The barrier is access to capital at a rate that makes the switch cash-flow-positive from day one.
Industrial heat finance at government cost of capital (Policy 10) removes that barrier: a $500 million revolving facility at OCR plus 0.5%, repaid from operating savings, displacing approximately 10 TWh of fossil heat per year. The R&D programme (Policy 11) funds the harder high-temperature problem — cement kilns, steel arc furnaces, processes above 300°C outside today's heat pump envelope — with $65 million over five years, 50/50 co-funded with industry.
Battle 4 — Molecule Supply (1 policy, $165 million direct, ~$500 million mobilised)
Once Battles 1, 2, and 3 are won, molecule demand collapses to the residual high-temperature industrial heat. Policy 12 creates 400 MW or more of registered flexible load through capacity payments and tax incentives for users who can ramp consumption on system signal. The strategic flexible load is modular compute — AI training and batch processing workloads that are location-agnostic and time-flexible. NZ has cheap renewables, a cool climate, and the political stability to host them. The electrons leave embedded in digital services. NZ keeps the jobs, the infrastructure spend, and the export revenue.
Battle 5 — Delivered Price (2 policies, ~$425 million direct, structural impact)
Policy 13 — wholesale market and price transparency reform — does three things: publishes the per-kWh component breakdown for every household, stands up a deeper hedging market, and addresses the windfall margin. The per-kWh visibility forces accountability. The hedge market reform opens the market to independent retailers who currently can't get bankable price certainty. The windfall mechanism — whether contracts-for-difference, pay-as-bid, or direct windfall capture — addresses an estimated $2.24 billion per year in inframarginal rent that the current structure lets flow to generation incumbents.
Policy 14 — distribution pricing reform plus public thermal backstop — directs the Commerce Commission to require EDBs to move pricing onto time-of-use and utilisation signals, and takes the residual thermal generation backstop off the profit-on-scarcity logic. The thermal backstop question — whether Crown owns or contracts the residual capacity on a cost-recovery basis — is the most politically loaded item in Battle 5. The $300 to $500 million cost range reflects the structure-dependency of that decision.
Battle 6 — Coordination Layer (2 policies, ~$56 million direct, ~$350 million enabled)
The cheapest battle by direct cost. Potentially the most consequential. Policy 15 publishes an open coordination standard covering metering data, DER telemetry, flexibility bids, and settlement, with mandatory adoption within 36 months. Policy 16 mandates open APIs as a condition of device connection, and extends Commerce Commission scrutiny to aggregation platform acquisitions.
Right now, the layer above the meter is contested ground. In 24 to 36 months, it won't be — either it's been defined by an open published standard, or it's been locked in by the platforms that moved first. Fifty-six million dollars is a small insurance premium against that outcome.
Consolidated 18-policy summary — cost, capital mobilised, system benefit
| # | Policy | Direct cost (5y) | Capital mobilised | Key system benefit |
|---|---|---|---|---|
| 1 | Residential Solar Lending Facility | Cost-neutral | $2,880m | 1.4 GW rooftop solar; $1,762/yr household saving |
| 2 | Residential Batteries for VPP | $135m | $575m | 250 MW peak shaving; 600 MWh storage |
| 3 | Public-Sector VPP Batteries | $130m | $130m | 250 MWh peak shaving across schools, hospitals, govt, marae |
| 4 | Government PPAs (firmed) | Cost-neutral | $1,700m | ~1,900 GWh/yr new firmed renewable supply |
| 5 | Fast-tracked Grid-Scale BESS | $85m | $275m | 500 MWh grid-scale storage; wholesale price stabilisation |
| 6 | Fleet operator TaaS incentives | $150m | $1,400m | 20,000 fleet EVs; ~190m L/yr petrol displaced |
| 7 | Fast-track road automation programme | $80m | $50m | NZ ready for AV operation by 2028-29 |
| 8 | National EV + fast-charger network (first-customer fix) | $130m | $300m | 500 fast-charger sites; removes network-tax barrier |
| 9 | Government fleet electric + autonomy-capable | $150m net | $225m | 15,000 govt vehicles; demonstration + demand anchor |
| 10 | Industrial heat finance (dairy + low-temp industrial) | $125m | $700m | ~10 TWh fossil heat displaced |
| 11 | NZ-made high-temp heat R&D | $65m | $120m | Solutions for residual 8.4 TWh of high-temp fossil heat |
| 12 | Flexible-load user incentives | $165m | $500m | 400 MW+ flexible load; compute-as-export |
| 13 | Wholesale market and price transparency reform | $25m | n/a | Per-kWh visibility; deeper hedge market; windfall neutralised |
| 14 | Distribution pricing reform + public thermal backstop | $400m | n/a | EDB pricing rewards flexibility; thermal off scarcity logic |
| 15 | Open coordination standard | $31m | $150m | Published architecture for metering, DER, flexibility bids |
| 16 | Mandated open APIs as condition of connection | $25m | $200m | No vendor lock-in; ComCom scrutiny on aggregator M&A |
| 17 | Equity package (targeted support + renters) | $295m | $500m | ~45,000 equity-targeted households reached |
| 18 | Regulatory measurement reform (ICP to MWh/MW) | $15m | n/a | EA / ComCom shift KPIs to real market share |
| Totals | $2,006m | $9,705m | 4.84× capital multiplier |
§6.2 Two cross-cutting reforms — equity and measurement
Policy 17 — Equity package ($295 million, ~45,000 households)
The Battle 1 financing instruments reach owner-occupiers with serviceable income. They don't reach social housing tenants, low-income owner-occupiers who can't service additional debt, or renters caught in the split-incentive trap: the landlord pays the capital cost, the tenant captures the energy saving, so neither acts.
The equity package has three elements. Targeted subsidies — not loans — for approximately 25,000 households (15,000 in social housing, 10,000 low-income owner-occupiers) at an average of $10,000 per household, administered through EECA and Kāinga Ora. Landlord tax incentives: accelerated depreciation on solar, batteries, heat pumps, and EV chargers installed in long-term rental properties, conditional on a seven-year retention period. And on-bill finance for rentals: a mechanism that recovers the cost of installed solar or batteries through the electricity bill rather than the landlord's balance sheet, transferring cleanly between tenancies and eliminating the split-incentive problem at its root.
The 45,000 households reached aren't a rounding error. They're the population most exposed to the vicious version of the transition: if Battle 1 financing runs fast while the equity package slips, network costs spread across a smaller base, fixed daily charges rise, and the households least able to exit the legacy grid subsidise those who can. Policy 17 doesn't just serve those 45,000 — it protects the structural integrity of the transition for everyone else.
Policy 18 — Regulatory measurement reform ($15 million)
No asset purchases, no subsidies, no new debt. Just a different metric.
The Electricity Authority currently measures retail competition in ICPs — installation connection points. A studio apartment using 4 MWh a year is one ICP. A heavy industrial site using 500,000 MWh is one ICP. Counting ICPs, the market can appear competitive while four dominant generator-retailers supply over 80% of actual energy consumed.
The ICP metric is also blind to what now matters: kilowatt-hours behind the meter, megawatts of demand response, aggregated home battery capacity dispatchable as a virtual power plant. Policy 18 directs the EA and Commerce Commission to retire ICP as the primary competition metric and replace it with MWh share, peak-MW demand response, and distributed generation share. $15 million over five years. It changes what the regulator rewards — which changes what the market builds.
This reform is upstream of every other policy in the package. As long as the regulator's success is measured in ICPs, distributed generation and demand-side flexibility remain effectively invisible. The metric is the incentive.
§6.3 Sequencing the work
The 18 policies stage deliberately across five years. Financing instruments land first, building political and operational momentum before the structural reforms face their heaviest incumbent pushback.
Year 1 — Stand-up: Financing facilities capitalised and in market. Solar lending live within 12 months. Fleet EV incentive launched. Industrial heat facility first loans approved. Government PPA first tenders to market. EA standards body stood up. Measurement reform ministerial direction issued.
Year 2 — First impacts: Residential solar, VPP batteries, fleet EVs, and government fleet at full deployment rate. First 100 fast-charger sites operational. New MWh/MW competition metrics published quarterly.
Year 3 — Structural reforms land: AV-readiness legislation passed, pilot zones operational. Wholesale transparency live, hedge market reforms operational. Distribution pricing reform at the next DPP reset. Open coordination standard published, API mandate live for new installations. Rental WoF energy standards operational.
Years 4-5 — Full rate and consolidation: All 18 policies operational. Lower wholesale prices, deferred network upgrades, reduced peak demand visible across the system. Equity-targeted household coverage approaching 45,000. Mandatory coordination standard adoption complete at month 60. Programme-wide independent evaluation against the headline numbers in the consolidated table.
The sequencing is the policy. Financing instruments first means the structural reforms arrive with demonstrated evidence and existing beneficiaries — not just theoretical arguments. That changes the political fights those reforms face.
§6.4 The reality check — where the parties actually are
Of 126 policy-by-party cells in the June 2026 manifesto comparison — 18 policies across seven parties — four are a full match. Three sit with the Greens. One with Te Pāti Māori. Everything else is partial, silent, or opposed. The 2026 election is being fought without the package on offer.
The white space
Four policies have no taker among any of the seven parties. Not partial. Blank.
Policy 7 (AV-readiness), Policy 15 (open coordination standard), Policy 16 (mandated open APIs), and Policy 18 (ICP-to-MWh measurement reform). The coordination layer and the automation pathway are uncontested political whitespace. These are among the most differentiated ideas in the Kick-start — and the least contested.
Where parties cluster
Two levers attract near-universal engagement: wholesale market reform (Policy 13) and the equity package (Policy 17). Every party touches wholesale reform. Six of seven touch equity. Neither counts as engagement on the mechanism.
Every party says "fix the gentailers." None publishes a hedge-market design. None specifies a windfall-capture instrument. The Kick-start does. Differentiation lives in the mechanism, not the direction. Same on equity: every party except ACT acknowledges the problem. The question is whether they have a delivery instrument — on-bill finance, the split-incentive fix for renters, the targeted subsidy structure — or whether they're announcing a direction and leaving the mechanism blank.
Party by party
Greens are closest: 14 of 18 policies touched, three Full matches. The Clean Power Payment ($6,000 grants plus $30,000 interest-free loans, prioritising low-income and renters), a Member's Bill for functional gentailer separation, and the strongest equity commitment of any party. The divergence from the Kick-start is in design: the Greens reach the same goals through grants and public ownership where the Kick-start uses lending facilities and market mechanisms. Grants cost more per household delivered. Lending facilities recycle capital.
National is Partial-heavy and supply-side oriented: 11 Partial, 7 Missing, 0 Full. The record includes the Fast-track Approvals Act, gentailer non-discrimination rules from July 2026, a $1.2 billion Gas Transition Loan Guarantee, and $30 million in schools solar from Budget 2026. No national energy strategy, no household solar lending, no VPP or fleet-EV subsidy, no windfall capture, no demand-side investment.
Labour has direction without detail: 8 Partial, 10 Missing. Energy is a top-tier election issue but Labour has not published a 2026 platform. Identifiable positions inherit the 2023 cycle — Clean Car Discount reinstatement, gentailer structural separation "not off the table," defence of GIDI and Warmer Kiwi Homes. The supply-side and digital infrastructure policies are largely absent.
NZ First operates through an affordability-via-fossil-backstop lens: 5 Partial, 12 Missing, 1 Opposed. Shane Jones champions domestic coal at Huntly, the LNG terminal, and a $200 million gas-exploration fund. Aligns loosely with the thermal backstop (Policy 14) and wholesale reform (Policy 13) — as fossil-first and structural ownership, not transitional cost-recovery or hedge-market design. Actively opposes industrial heat electrification.
ACT is the most clearly positioned and the most directly opposed: 3 Partial, 6 Missing, 9 Opposed. ETS-led decarbonisation, remove regulatory barriers, fund nothing through grants. The delivered record — RMA replacement, Fast-track Act, oil-and-gas ban repeal, Clean Car Discount scrapped, coal-boiler phase-out repealed — is consistent with that doctrine. The nine oppositions aren't oversights. They're positions.
TOP punches above its parliamentary weight with a published "Abundant Energy" policy: 30 GW renewables by 2050, low-interest electrification loans funded by ring-fencing gentailer dividends, and consolidating the 29 EDBs into up to eight. Pro-competition, pro-efficiency, ETS-led. Weak on DER, VPP, API, and compute-load detail. Seven Partial, 11 Missing.
Te Pāti Māori leads on equity and marae sovereignty: a $1 billion Pūngao Auaha clean-energy fund for marae, papakāinga, kura and community-owned solar, mass rooftop subsidies, a Marae Resilience Package, and targeted EV support for rural whānau. One Full (equity), strong on community resilience. No articulated position on technical market design — PPAs, hedge reform, open standards, distribution pricing, or measurement.
Coverage is shallow and clusters on the two most visible levers. The supply-side, the coordination layer, the automation pathway, and the measurement reforms are largely unclaimed. That's the political landscape as of June 2026.
The choice in front of NZ
There is a leadership vacuum on energy in New Zealand. The 2026 election is the last full electoral cycle before the 2030 horizon. Whichever party names energy prosperity as a platform owns it — the destination is concrete, the technology is proven, and the gap between today's $8,739 household energy bill and the $3,125 available by 2030 is measurable and deliverable.
The destination is concrete. The path is six battles. The technology has done its job.
Without active reform, the existing market structure will absorb and slow the transition. The fixed-charge trap, the wholesale market windfall, the captured coordination layer — these are designed responses by institutions that built the current system. They will not dismantle themselves.
Energy prosperity by 2030 is a choice.