Aotearoa's Energy Prosperity
A regular Kiwi household spends $8,739 a year on energy today. By 2030 that number can be a third to two‑thirds smaller — on technology that already exists.
Aotearoa's Energy Prosperity.
A 2030 Vision.
The shift from $8,739 to $5,417 — or $3,125 — is one energy transition, fought across six distinct battles. Each has its own physics, its own incumbents, its own near-term policy levers.
Solar, batteries, EVs and heat pumps are commodities being deployed globally at exponential pace. What's holding New Zealand back is a market designed for centralised generation, regulatory frameworks designed for passive consumers, and a financing system designed for a different kind of asset. Energy prosperity by 2030 is a choice.
The household energy bill, a third to two-thirds smaller.
A regular New Zealand household spends $8,739 a year on energy today. By 2030 that number could be $5,417 if they own an electric vehicle, or $3,125 if they shift to autonomous Transport-as-a-Service.
That's a 38 to 64% reduction in total household energy spend, on technologies that exist today and follow established cost curves. The destination is a household energy bill that's a third to two-thirds smaller. Electricity costs that fall rather than rise. Transport that costs $10 per 100 km instead of $46. An energy system that's more resilient to global shocks than the one we have today.
Where the savings come from
| Cost line | Today | 2030 · EV-owned | 2030 · TaaS |
|---|---|---|---|
| Electricity (incl. electrified heat) | $2,625 | $1,925 | $1,925 |
| Gas | $800 | $0 | $0 |
| Petrol / charging | $2,734 | in elec | in TaaS |
| Vehicle ownership ex-fuel | $2,580 | $2,580 | $0 |
| Road User Charges | $0 | $912 | $0 |
| TaaS (12,000 km @ $10/100km) | $0 | $0 | $1,200 |
| Total | $8,739 | $5,417 −38% |
$3,125 −64% |
The technology has done the hard part. The only thing missing is the structural policy reform to make that prosperity equitable and fast.
Six battles decide whether households land at $5,417 or $3,125.
The path runs across six battles: who supplies the electrons, who powers motion, who heats things, who supplies the molecules that remain, who captures the deflation in delivered prices, and who owns the coordination layer above the meter.
The gap between today and 2030 is structural. Solar, batteries, EVs and heat pumps are commodities being deployed globally at exponential pace. What's holding NZ back is a market designed for centralised generation, regulatory frameworks designed for passive consumers, and a financing system designed for a different kind of asset.
Two reform imperatives cut across all six battles
Equitable financing. The technologies that underpin the new system share an economic profile — high upfront capital cost, very low ongoing running cost. Without accessible finance, renters support, and targeted subsidy for the vulnerable, the transition delivers prosperity narrowly and accelerates inequality for everyone else.
Better metrics. Today's market assessment relies on ICP counts — a metric that treats a studio apartment and an industrial smelter as equal. Shifting to megawatt-hours traded, peak capacity provided by demand response, and the share of distributed generation in the mix would redefine the market as a dynamic system of active participants.
A regular Kiwi household spends $8,739 a year on energy.
Three components — electricity, transport, heat. Each is moving in a direction that makes it heavier.
Where the $8,739 goes.
The burden has three components. Electricity, transport, and heat. Each is moving in a direction that makes it heavier.
Gas cooktop, gas hot water, two ICE vehicles in the garage and electricity for everything else. The gas and petrol lines together account for $3,534 — 40% of the bill — and both are on upward price trajectories.
Electricity prices have risen ~35% nominal in a decade while upstream unit costs fell 70–90%. Gas is getting more expensive and supply is contracting. Petrol remains directly exposed to global oil markets.
A centralised system passing on its costs.
The average household pays approximately 35 cents per kilowatt-hour delivered. 32.5% of that is network charge — the structural fee for moving energy from where it's generated to where it's used.
Any technology that generates and stores energy at the point of consumption — rooftop solar, home batteries — competes with the full delivered cost, including the 32.5% network charge that disappears when energy is used where it's made. The economic value of distributed generation is systematically undervalued when compared only to wholesale generation costs.
There's a deeper market failure underneath. The cost of generating electricity has fallen dramatically over the past decade. Upstream solar costs are down 90%, batteries down 90%, wind down 70% (BNEF, Lazard, 2014 to 2024). NZ's delivered residential price went the other way, rising around 35% in nominal terms over the same period, well above wages and above CPI. The technology deflation that should have flowed to consumers has been captured somewhere in the delivery chain.
Network costs are not done rising. The Commerce Commission has approved EDB revenue increases of approximately 37% in real terms across the next regulatory period. Transpower forecasts further multi-billion investments in grid-exit points and substations. SEANZ Report 4 puts cumulative network investment over the next decade at $12 to 14 billion under current planning.
Direct exposure to global commodity markets.
A typical Kiwi family driving 12,000 km a year in a petrol car spends $2,734 on fuel. That's direct exposure to global oil markets. The like-for-like comparison is already in favour of EVs.
TaaS compounds this further. If the destination is autonomous shared mobility at $10 per 100 km, the full cost of personal transport collapses to a quarter of today's TCO.
Gas getting more expensive while supply contracts.
About 30% of New Zealand homes use piped gas for hot water, space heating, or cooking, paying around $800 a year on average. Domestic gas production has fallen sharply — industrial and SME users report up to 100% price increases on contract renewal.
EECA research shows 70 to 80% of gas-dependent businesses see electric alternatives as theoretically possible but financially unattractive. Yet heat pumps at COP 3 to 5 versus gas at 75 to 95% have been ready for years.
Same household. Same life.
A third to two-thirds less energy spend.
Three changes get us there. Electricity becomes substantially self-generated. Transport runs on electrons or dissolves into a service. Heat goes electric.
What regular Kiwis could be paying in 2030.
The same household that spends $8,739 a year on energy today could spend $5,417 by 2030 if they own an EV, or $3,125 if they shift to Transport-as-a-Service. That's a 38 to 64% reduction in total household energy spend, on numbers anchored to NZ-realistic technology costs and a conservative deflation trajectory.
cut elec.
replace gas
→ electrons
on EV
The destination is reached through three changes. Electricity at home becomes substantially self-generated. A 7 kW rooftop system (approx. $7,000 in 2030) produces ~10,200 kWh/yr. A 13 kWh home battery (~$5,200) stores midday generation through to evening peak. Combined with V2H from the household EV, self-consumption reaches 80%.
How the 2030 household bill actually gets built.
Electricity at home becomes substantially self-generated. A 7 kW rooftop solar system (approximately $7,000 in 2030) produces around 10,200 kWh per year — roughly equivalent to an average household's full annual demand once gas heating's been replaced by heat pumps.
A 13 kWh home battery (~$5,200) stores generation through to evening peak. With V2H from the household EV, self-consumption reaches 80%, leaving only 20% to be drawn from the grid.
Transport runs on electrons. Vehicle ownership cost is roughly unchanged. Fuel cost collapses. Charging is largely from rooftop solar via V2H. The only direct cost is RUCs at $912 per year.
The vehicle becomes mobile household storage, supplying peak-hour power back to the home and reducing the dedicated stationary battery requirement by roughly a third.
Transport becomes a service. Autonomous shared mobility at $10 per 100 km replaces vehicle ownership entirely. The household no longer buys, fuels, registers, insures, or maintains a vehicle.
The full transport cost line collapses to $1,200 a year — a 77% reduction on today's combined cost of vehicle ownership and fuel.
Heat is electric. Heat pumps deliver 300 to 500% efficiency (COP 3 to 5) compared to gas at 75 to 95%. The gas line on the bill goes to zero.
The additional electricity demand is largely covered by the rooftop solar.
Three conditions for the destination
These outcomes require three things to be true. The technologies need to continue their cost decline — they will. The household needs to be able to access capital to install them — a financing question. The regulatory architecture needs to allow distributed energy resources to compete fairly with centralised generation — a policy question. The technology will look after itself. The financing and policy questions are what the rest of this vision is about.
NZ's most recently published residential battery cost is $900/kWh installed (Rewiring Aotearoa, 2025). Applied with a 15% per year cost reduction (conservative against the global trajectory), battery costs reach $399/kWh by 2030. A 13 kWh home battery, downsized from 20 kWh because EV V2H reduces dedicated storage requirement, costs approximately $5,200 installed.
Today's global benchmark for utility-scale batteries is $125/kWh all-in (BNEF 2025). NZ at 2030 ($399 residential, $367 grid-scale) remains roughly 3× more expensive than today's global utility-scale price. The 15%/yr deflation assumption leaves substantial headroom.
Solar −94%.
Batteries −91%.
In fifteen years.
Three technologies do the work: solar generates the electrons, batteries store them, electric drivetrains and heat pumps use them. All three follow the same falling cost curve.
The same cost curve that drove TVs, smartphones, broadband.
In a resource-dependent system, every kilowatt-hour requires fresh extraction — the curve trends up. In a technology-dependent system, every kilowatt-hour is the output of a manufactured thing that gets cheaper with every doubling of cumulative production.
Three technologies do the work. Solar panels generate the electrons. Batteries store them. Electric drivetrains and heat pumps use them. All three follow the same falling cost curve.
Democratised generation.
Every kWh generated and consumed behind the meter avoids not just the 38.5% generation component, but the full 32.5% network charge. Distributed generation competes with delivered electricity, including the network charges and retail margin layered on top. Once compared honestly, the case for rooftop solar is overwhelming for any household that can finance it.
The prosumer enabler.
Solar without storage covers only the daytime. Batteries time-shift cheap midday energy to the evening peak — turning a household from passive consumer into active prosumer.
The historical barrier was cost. NZ's most recent published residential battery cost is $900/kWh installed (Rewiring Aotearoa, 2025). At 15%/yr cost reduction, that reaches $399/kWh by 2030. A 13 kWh battery + V2H allows 80% self-consumption from a 7 kW system.
Coordinated, the distributed fleet becomes a vast virtual power plant — absorbing excess generation, injecting power to stabilise the grid at peak, and slashing the need to run fossil peakers. System costs fall for everyone, not just battery owners.
The disruption of personal mobility.
Autonomous EVs under a TaaS model change two structural things about transport: asset utilisation and operational lifetime. The combination amortises capital cost over a vastly larger number of revenue-generating kilometres.
RethinkX's central forecast is 16 US¢ per mile by 2030, falling to 5 US¢ for shared, pooled services — $5 to $16 NZD per 100 km. Our planning assumption is $10 NZD per 100 km, the optimistic but plausible end of the range. Autonomous fleets in China and the US are now clocking millions of kilometres with progressively less human intervention; per Waymo safety data, at-fault crash rates for fully driverless miles run well below the human baseline in matched conditions.
The product is just better.
Mass adoption happens when a new product is much better and cheaper than the incumbent. The energy transition's no different. Consumers won't switch primarily for climate reasons or because of government mandates. They switch because the new options are tangibly better.
EVs are quieter, accelerate harder, require less maintenance, and cost less to run than equivalent petrol cars. Solar and battery ownership turns the household from a passive bill-payer into an active producer. The collective pull of millions of household decisions, all chasing better and cheaper, is the primary engine. Policy can accelerate or obstruct that engine; it cannot substitute for it.
Even heavy logistics electrifies because the running-cost gap is too big to ignore. On the Auckland to Tauranga freight corridor, an electric truck saves roughly NZ$277 per trip against diesel — an 81% reduction in fuel cost, with fleet payback running under 5 years at current crisis pricing.
From centralised to cellular.
The grid architecture that fits these new technologies is cellular. Dutch energy researcher Auke Hoekstra calls it a holonic system — a holon being an energy community that's both a whole in itself and a part of a larger whole, ranging from a single building to an entire region.
A house with rooftop solar, battery and EV becomes a solar building holon. A street of these houses forms a neighbourhood holon, sharing energy among its members — the school with excess midday solar can power the EV chargers across the road. Imagine batteries at the end of most streets like the fibre cabinets, and larger batteries at neighbourhood scale like the Chorus exchange buildings. These holons connect to form larger solar zones incorporating data centres and transport hubs, which in turn connect to the high-voltage national grid.
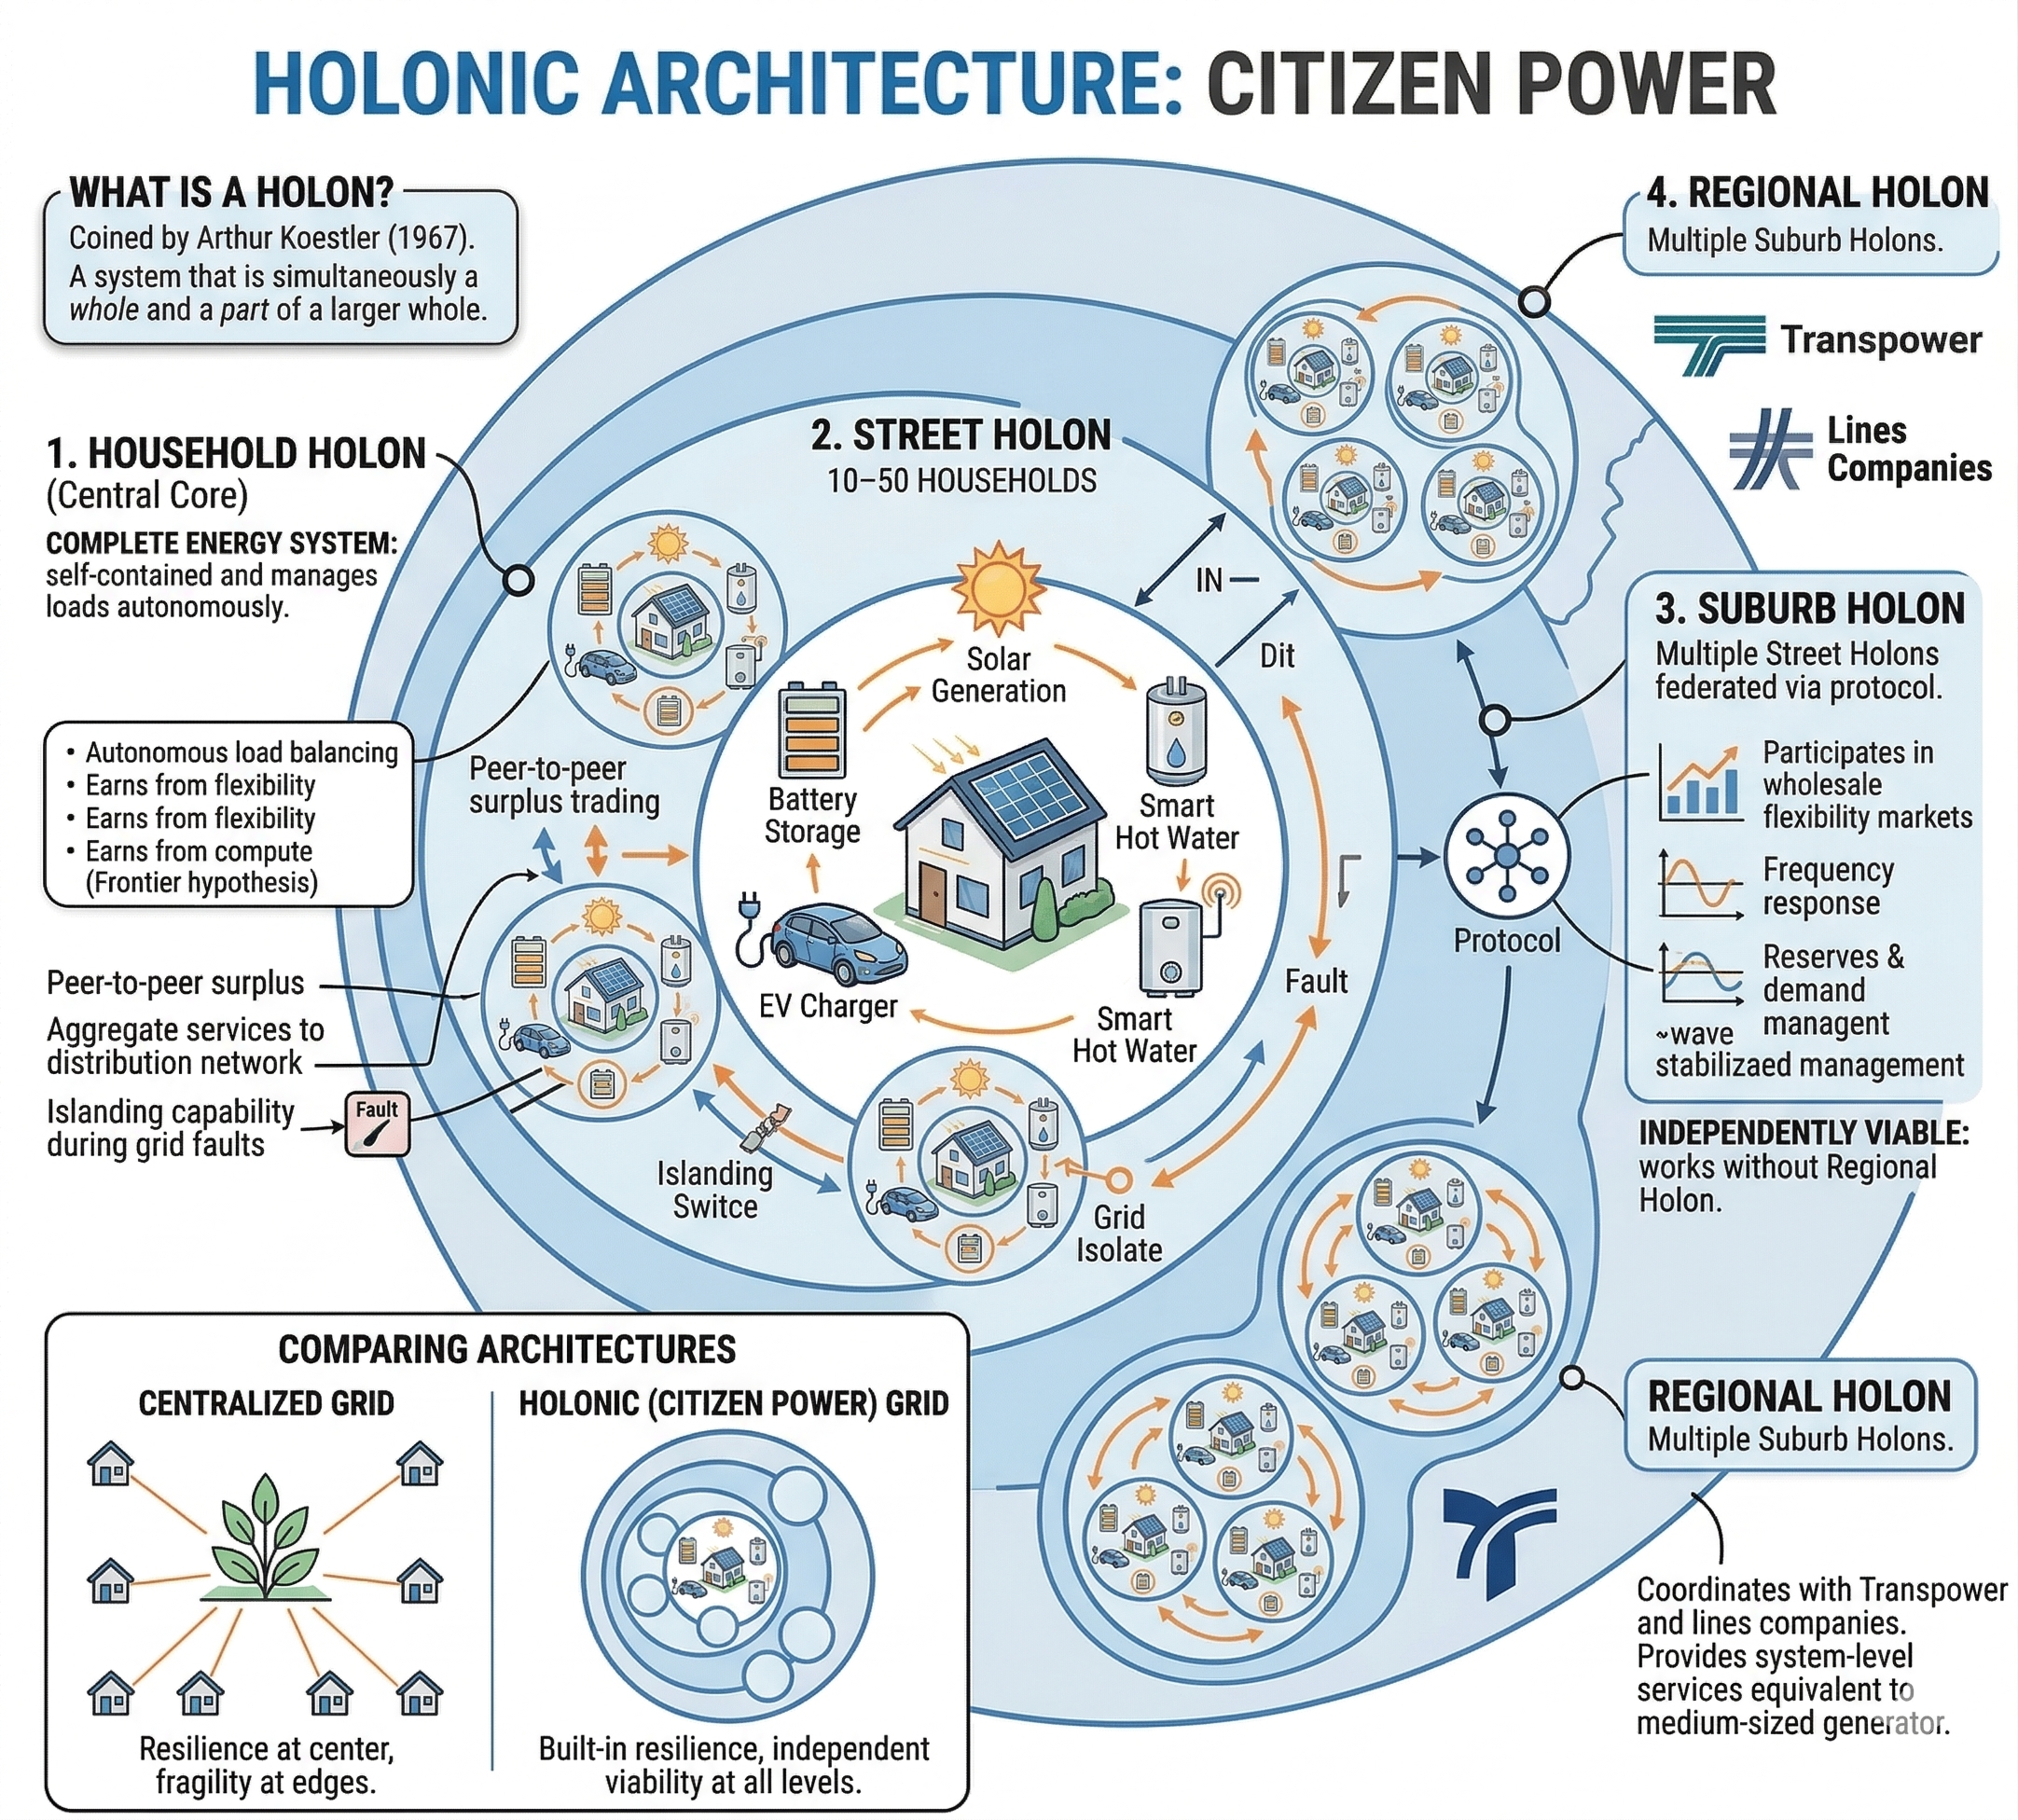
This cellular architecture offers two transformative benefits — covered overleaf.
Two transformative benefits.
A cellular grid changes the economics of the network and changes the resilience profile of the country. Both are structural — they do not depend on any one technology choice.
01 · Minimises grid costs
In the current paradigm, the national grid must be built to handle the simultaneous peak demand of millions of individual homes and businesses. In a holonic system, the majority of balancing happens at the local level. The national grid only needs to manage the much smaller, smoother, less volatile net demand of entire self-balancing neighbourhoods. That dramatically reduces the need for expensive transmission and distribution upgrades — the multi-billion-dollar capex that currently drives rising lines charges on every household's bill.
02 · Creates resilience
The current grid is vulnerable to single points of failure: a fault on a major transmission line can cause widespread, prolonged blackouts. A cellular grid keeps working when one piece fails.
In the event of a major disruption, individual holons — neighbourhoods, business parks, entire towns — can island themselves from the main grid and continue to operate on their local solar and battery resources. For a country exposed to seismic events and increasing extreme weather, that's a structural advantage.
The lines charge component of the electricity bill — the multi-billion capex driver that distributed, self-balancing neighbourhoods don't need.
The cost of disaster recovery and the system-cost premium NZ pays for being a small, geographically dispersed grid.
The path from today to 2030 and beyond.
The shift from $8,739 to $5,417 — or $3,125 — is one transition but six battles. The first four are about the energy we use. The last two are about the delivery chain itself. Each battle is happening simultaneously. Which ones we're winning determines where the household cost panel actually lands.
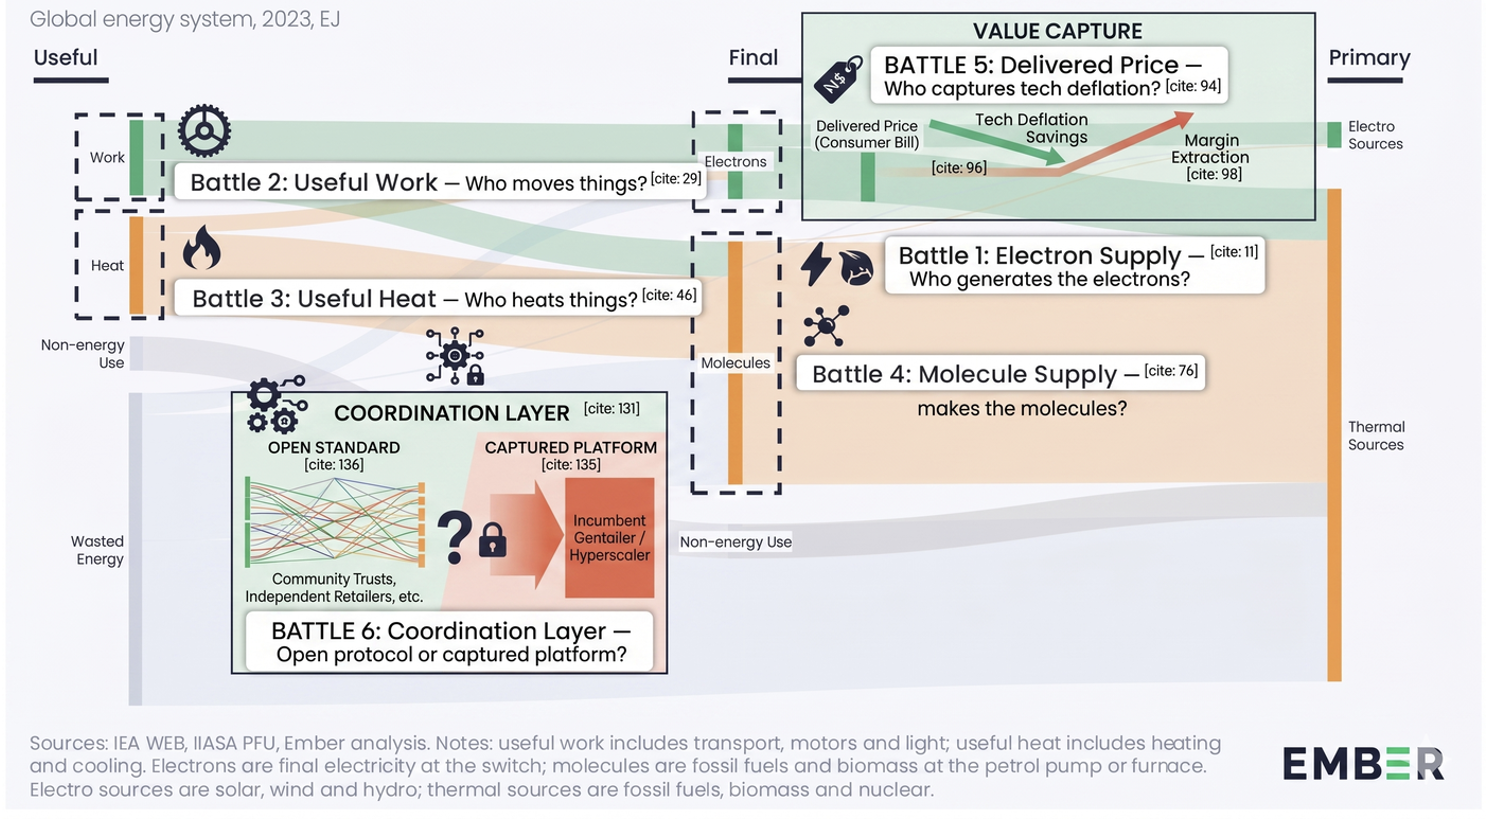
Clean sources vs thermal.
NZ starts in a strong position thanks to our grandparents' hydro infrastructure. About 85% of generation is renewable. That sounds good. What it hides is that solar is only 3% of our generation today, despite being the cheapest source of electricity available over its lifetime. The market structure rewards scarcity (gas peaking to protect lake levels) not abundance. That's a policy failure, not a resource constraint.
The electricity bill — by reducing wholesale prices and letting distributed generation bypass network charges.
Electrons versus molecules to power motion.
Electric motors convert electricity to motion at over 90% efficiency. Internal combustion engines manage around 25%. That's a 3× efficiency gap baked into the physics.
Globally, electricity supplied 80% of the change in useful work demand between 2019 and 2023. Oil demand in transport could peak around now, per the IEA. China appears to have already passed its peak-oil phase. In NZ, EV adoption is happening but slowly, farm machinery electrification is underway, and the economics already make sense.
The petrol line and the vehicle ownership line — the largest single chunk of the household energy spend.
The hardest of the four demand-side battles.
Heat is 43% of NZ's useful energy demand, nearly equal to motion, and the sector where fossil fuels are most entrenched. NZ's total heat demand is 59 TWh/yr; fossil fuels supply ~27 TWh of that — 45% of all heat. The good news: heat has a temperature structure, and so does the solution.
| Temperature range | Total demand | Fossil fuel | Already electric | Electrifiable? |
|---|---|---|---|---|
| Low Temp <100°C | 25.3 | 12.9 | 10.3 | Yes, now |
| Medium Temp 100–300°C | 14.8 | 5.4 | 1.8 | Yes, near-term |
| High Temp >300°C | 13.4 | 8.4 | 5.1 | Hard, Battle 4 |
| Cooling & Refrigeration | 5.5 | 0 | 5.5 | Already done |
| Total | 59.1 | 26.7 | 22.7 | 18.3 TWh prize |
Dairy is the single biggest target. 7.6 TWh of fossil heat/yr — by far the largest industrial heat user in NZ. Dairy processing sits mostly in the 80–160°C range, squarely where industrial heat pumps now compete.
The block: EECA research finds 70–80% of gas-dependent businesses see transition as theoretically possible but financially unattractive. Gas contracts are doubling on renewal; supply has fallen 45% in six years.
The gas line on the household bill, and indirectly the cost of every dairy product, meat product, and processed food a Kiwi household buys.
What's left after we electrify everything we can.
The fourth battle is about who supplies the molecules that remain once we've electrified everything we can — petrochemical feedstocks, high-temperature industrial processes, hard-to-abate sectors. Converting electricity back into molecules (green hydrogen, ammonia, synthetic fuels) runs at ~70% efficiency vs ~85% for fossil. Winning Battles 1, 2 and 3 makes Battle 4 smaller: ~8 TWh of hard-to-abate high-temp heat remains vs today's 27 TWh.
Markets cheap solar opens up
NZ as a green-molecule producer
RethinkX's Prosperity scenario models NZ generating 104 TWh total by 2045: 64 TWh of firm baseload and 40 TWh of surplus, built to cover the worst-case winter day. The surplus has near-zero marginal cost. At that price, green hydrogen and ammonia become economically viable to manufacture domestically.
NZ stops importing fossil fuel molecules and starts making the clean molecules that remain in the system. The flow runs both ways: domestic decarbonisation, and an export footprint for the clean-molecule markets coming online globally over the 2030s.
The macroeconomic line that runs through every Kiwi household. Replacing imported fossil molecules with domestic clean ones flows through wages, exports, and the cost of every imported good.
Upstream −90%. Delivered price +35%. That gap is margin.
Every input to electricity is a technology — panels, batteries, turbines, inverters, chips — and technologies get cheaper. Solar costs are down 90%, batteries down 90%, wind down 70% over the last decade. NZ's delivered residential price went the other way, rising around 35% in nominal terms over the same period.
Three extractors do most of the work.
Eleven years of extraction over investment
Over the eleven years since partial privatisation, the major generator-retailers paid $9.45 billion in dividends against $1.38 billion in new renewable capex — a 7:1 ratio of extraction to investment. The cheap renewable energy is being priced as if it were expensive thermal energy, and the difference is kept as margin.
Distribution pricing prioritises asset utilisation over peak capacity expansion. Network cost recovery moves onto time-of-use and utilisation-based signals, away from the escalating fixed daily charge that penalises households investing in solar and batteries. Wholesale design removes the windfall margin in abundant hours; the residual thermal backstop is treated as a public resilience asset rather than a private profit centre. Retail bills publish the makeup of every delivered kWh by component.
Above the meter, below the market.
Between household hardware (solar, batteries, EVs, hot water, heat pumps) and the wholesale market sits a coordination layer. It does metering, aggregation of flexibility, wholesale bidding, and settlement. Whoever owns this layer captures the value the hardware below produces.
What "open" looks like
NZ adopts an open coordination standard covering metering data, telemetry from household solar and battery hardware, flexibility bids, and settlement. Any firm meeting the standard can compete. The layer's not owned by anyone — it's published.
Hardware ownership stays with citizens and community. Flexibility value flows to whoever aggregates it, competed down to a thin service fee.
In other markets, platform incumbents are setting the default right now. In NZ, the layer is still contested. The next 24 to 36 months decide whether the default is platform or protocol.
own hardware
What the standard must cover
The six battles describe the path.
Two reforms decide
whether anyone can walk it.
Equitable financing decides whether the path is open to every household or only to those who can afford the upfront capital. Better metrics decide whether the regulator can see the transition in progress and reward the participants who deliver it. Get those two right and the package of policies in the companion Kick-start has the foundation it needs. Get them wrong and the technology transition concentrates wealth and slows.
Or the transition concentrates wealth.
The technologies that underpin the new system — EVs, rooftop solar, home batteries, heat pumps — share an economic profile: high upfront capital, very low running cost. That profile means wealthier households go first.
The two-tiered system that follows
- Own roof, own capital → install solar + battery
- Buy EV → escape petrol entirely
- Heat pump → escape gas entirely
- First to escape rising lines and gas charges
- No capital, no roof, no decision rights
- Pay rising lines charges to maintain a grid that's now a backup for Tier 1
- Stay exposed to imported petrol
- Cross-subsidise the transition without benefiting
The market response makes it worse
Distribution companies will move more revenue onto fixed daily charges. That does two damaging things at once. It makes disconnecting from the grid the rational choice for any household that can afford to build its own infrastructure — accelerating the death spiral. And it kills the business case for the very household investments that would have helped the system out, because savings from your own electrons get neutralised by the rising fixed charge regardless of how little grid power you use. It's like applying Road User Charges to EVs but not to petrol cars. It stops adoption in its tracks.
A comprehensive equity strategy needs three pillars
Government intervention here is an economic necessity. Without it, the transition delivers prosperity narrowly and accelerates inequality for everyone else.
The technology transition delivers prosperity to those who can afford it and accelerates inequality for everyone else.
Measuring what actually matters.
The effectiveness of any regulatory regime depends on what it chooses to measure. For too long, the assessment of competition in NZ's electricity retail market has relied on the number of active retailers and their share of installation connection points (ICPs). That metric is fundamentally misleading.
apartment
smelter
The ICP metric is also blind to what now matters most in the modern energy system: the kilowatt-hours generated behind the meter, the megawatts of demand response that reduce peak load, and the capacity of aggregated home batteries that can be dispatched as a virtual power plant. These are the true sources of innovation and competition that challenge the incumbent model. An ICP count can't see them.
What the regulator should measure instead
A seemingly small administrative change — switching the metrics — is one of the most powerful levers available. It redefines the market as a dynamic system of active, distributed participants, and aligns the regulator's success with the transition itself.
What's left is structural reform and political will.
Without active reform, the existing market structure will absorb and slow the transition rather than enable it. The fixed-charge trap, the wholesale market windfall, the captured coordination layer — these are designed responses by the institutions that built the current system. They won't dismantle themselves.
- Energy elite captures most of the savings
- Death spiral on the legacy grid for everyone else
- Coordination layer captured by platform incumbents
- Tech deflation absorbed by margin, not delivered to households
- NZ becomes a rule-taker on green molecules, not a producer
- Household energy spend falls $3,300 to $5,600/yr
- Open coordination protocol; flexibility revenue flows to households
- Wholesale and network reform delivers the deflation downstream
- RAS-style finance + targeted support reach renters and low-income households
- 40 TWh of surplus generation makes NZ a green molecule producer
$8,739 → $5,417 → $3,125.
A 2030 vision for New Zealand.
This document was prepared by The Exponential Agency to describe what energy prosperity looks like for a regular Kiwi household by 2030, the technology pathways that get us there, and the structural reform needed to deliver the savings to every household — not just those with capital to go first.